
A steep glucose spike is metabolically stressful, but eating vegetables and protein before carbohydrates flattens the curve dramatically: animated charts show the difference and justify the simplicity of the intervention.
Blood sugar spikes and crashes after meals. This is normal. Your body breaks down carbohydrates into glucose, absorbs it, and your blood glucose rises. Your pancreas releases insulin, which pushes glucose into cells, and your blood glucose falls. The cycle is natural.
But the speed and magnitude of that spike matters. A steep, rapid spike followed by a sharp crash is more metabolically stressful than a gradual rise and gentle fall. And the order in which you eat your meal components determines how steep that curve becomes. This matters far more than most people realise.
The Baseline Glycemic Response
> The short version: A Scrollchart showing a steep spike versus a flat curve side-by-side reveals why meal order (vegetables-then-protein-then-carbs) is such a leverage point, backed by visible metabolic consequence.
When you eat a meal with carbohydrates, your blood glucose rises. The degree of rise depends on:
The carbohydrate amount (more carbs = larger spike, though not perfectly linear).
The carbohydrate type (simple sugars spike faster and higher than complex starches, which spike faster than fibre-rich carbs).
The fibre content (fibre slows absorption and flattens the curve).
The fat content (fat slows gastric emptying, moderating the spike).
The protein content (protein doesn’t raise blood glucose much directly, but slows overall absorption).
The glycemic index and glycemic load are attempts to quantify this, but they’re imperfect because they measure the response to a carbohydrate in isolation, not in combination with other food.
A piece of white bread eaten alone produces a steep glucose spike. That same bread eaten with butter and cheese produces a flatter curve. The food is identical, but the surrounding food changes the response.
What a Normal Glycemic Curve Looks Like
Rise gradually over 15-30 minutes. Peak at roughly 30-45 minutes after the start of eating. Decline gradually over the next 1-2 hours, returning to a baseline similar to where it started.
Peak glucose might be 120-140 mg/dL (6.7-7.8 mmol/L) above baseline, depending on meal size and composition. The key word is gradual. No sharp spike, no sharp crash.
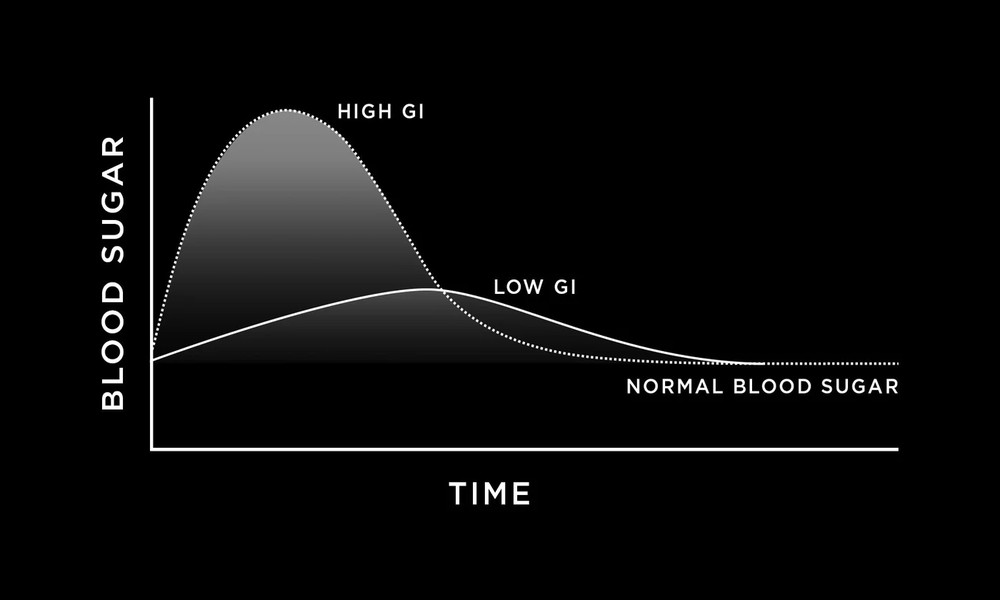
When you eat a pure carbohydrate meal (white bread, juice, pasta with no protein or fat), the curve looks different:
Very rapid rise, peaking sharply at 30-40 minutes. Much higher peak, potentially 160-200+ mg/dL (8.9-11.1 mmol/L) above baseline. Sharp decline afterwards as insulin is mobilised aggressively. Often a dip below baseline (“rebound hypoglycaemia”), which creates the post-meal crash feeling.
The steep and sharp curve is metabolically stressful. Your pancreas must release more insulin to handle the rapid glucose influx. Your liver can only take up so much glucose, so the excess stays in circulation longer, exposing your tissues to high glucose concentrations. High glucose damages blood vessel walls and accelerates glycation (glucose bonding to proteins), contributing to vascular damage over time.
The sharp decline afterward often leaves you temporarily low in blood glucose (relative to your peak), which triggers hunger and fatigue.
The Meal-Order Effect
Here’s where the practical power lies: the order in which you eat components of a meal profoundly affects the glucose curve, even when the total meal is identical.
This was systematically studied by Dr. Jessie Inchauspe, who found that consuming protein and fibre (vegetables) before carbohydrates significantly flattens the glucose spike.
The mechanism is multi-fold:
Protein first slows gastric emptying. The stomach empties its contents more slowly when protein is present. This means carbohydrates are absorbed more gradually.
Fibre first (via vegetables) creates a physical matrix that slows glucose absorption in the small intestine. Glucose molecules are dispersed through fibrous material instead of being absorbed as a concentrated bolus.
Fat first also slows gastric emptying, though we’re focusing on protein and fibre here.
In practical terms: eating a salad, then protein (chicken, fish, tofu), then starch (rice, bread, pasta) produces a noticeably flatter glucose curve than eating the rice first and the salad last. Same meal, same total carbohydrates, but the curve is dramatically different.
The practical effect is measurable:
Glucose peaks 20-30% lower when vegetables and protein precede carbohydrates. The rise is much more gradual, spread over a longer period. The crash afterward is much less severe because there’s no sharp decline to overshoot.
Why This Matters Beyond Blood Sugar
You might think: “So what if my glucose is 140 vs. 160 for an hour?” The cumulative effect over years is substantial:
Insulin sensitivity: Repeatedly spiking glucose high and crashing low damages insulin sensitivity over time. Your cells become less responsive to insulin’s signal. What was a 20% overshoot becomes a 40% overshoot as you become increasingly resistant. This is the pathophysiology of type 2 diabetes.
Hunger and satiety: Sharp glucose crashes trigger hunger and cravings. Flatting the curve keeps you more satiated and reduces afternoon snacking.
Energy levels: Avoiding the crash means avoiding the energy dip. Consistent energy throughout the day is far easier to achieve with flattened glucose curves.
Cognitive function: Glucose availability is crucial for brain function, but extreme fluctuations impair focus. Stable glucose = better focus and mental performance.
Inflammation: Chronically elevated glucose accelerates non-enzymatic glycation (proteins bonding with glucose molecules), which activates inflammatory pathways. Flattening curves reduces this.
Fat accumulation: Chronically high insulin (driven by repeatedly spiking glucose) promotes fat storage in visceral tissues. Flattening curves keeps insulin lower, favouring fat mobilisation.
Practical Application
The meal-order intervention is extraordinarily simple and works for most people:
Eat vegetables (salad, cooked vegetables, any high-fibre plant food) first.
Eat protein second (meat, fish, dairy, legumes, tofu).
Eat starches and sugars last (bread, rice, pasta, dessert).
This works for almost any meal configuration and requires zero calorie counting or restriction. You’re eating the same total amount, just reordering it.
For people with significant insulin resistance or blood-sugar dysregulation, the effect is dramatic. For people with normal insulin sensitivity, the effect is smaller but still meaningful.
The intervention is reversible: tonight, try eating your carbs last instead of first. If you have access to a continuous glucose monitor, you’ll see the curve flatten. If not, you’ll notice improved afternoon energy and reduced post-meal hunger.
Context Matters
Meal order works best when the total meal is reasonable. If you’re eating a 200g carbohydrate meal (exceptionally large), ordering it well helps but doesn’t reverse the basic fact that it’s a large carbohydrate load. The effect is most powerful on normal-sized meals with moderate carbohydrate content (50-100g).
Additionally, individual variation exists. Some people’s glucose curves flatten dramatically with meal order. Others see modest improvement. Genetics, training status, insulin sensitivity, and other factors influence the magnitude of the effect.
But even modest flattening (moving from a peak of 160 to 140 mg/dL) compounds over weeks and months into meaningful metabolic health improvements.
Visualising the Difference
Understanding why meal order matters is straightforward at a conceptual level. But seeing the actual glucose curves side by side (the steep, sharp spike of carbs-first versus the gradual rise of vegetables-first) makes the principle concrete in a way that numbers alone struggle to achieve.
When you can visualise how the curves change with different fibre contents, different protein amounts, and different timing, the logic becomes intuitive. Animated charts that show the glucose curve unfolding over time, the difference between meal orders, and the corresponding insulin response, clarify the physiology in a way that static explanations can’t match. Tools like Scrollchart make it possible to see the exact timing of the peak, the slope of the rise and fall, and the cumulative glucose exposure (all factors that drive long-term metabolic health outcomes).
The Takeaway
Meal order is a trivial intervention with outsized effects. You’re not restricting foods, counting calories, or changing meal composition. You’re simply reordering when you eat components you were eating anyway.
The glycemic curve is flattened, insulin response is moderated, and over weeks and months, insulin sensitivity improves, energy stabilises, and hunger decreases. It’s one of the highest-leverage, lowest-cost metabolic interventions available.
Try it tonight: vegetables first, then protein, then starches. Most people notice improved energy and reduced hunger within a single day. The science explaining why is straightforward. The practical benefit is substantial.
Frequently asked questions
How much does meal order actually flatten the glucose curve?
Research shows glucose peaks 20-30 percent lower when vegetables and protein precede carbohydrates. The rise is more gradual and the crash afterward less severe. A Scrollchart comparing the two curves side-by-side quantifies this visually, showing the same total meal producing dramatically different metabolic stress based purely on eating sequence.
Does meal order matter if I’m not insulin-resistant?
Yes. Even metabolically healthy people have lower glucose swings and better satiety with flat curves. Flattening the glucose curve is about long-term insulin sensitivity maintenance and consistent energy, not just treating existing resistance. The intervention is preventive as much as corrective.
Why is meal order easier to implement than other metabolic interventions?
You’re eating the same foods, same quantities, same calories. The only change is sequence. No deprivation, no counting, no supplements. Start with vegetables and protein, finish with starches. Scrollchart animations showing the practical glucose difference (140 vs. 160 mg/dL peak, for example) clarify why this tiny reordering produces measurable energy and satiety improvements.